2015 UK local government election
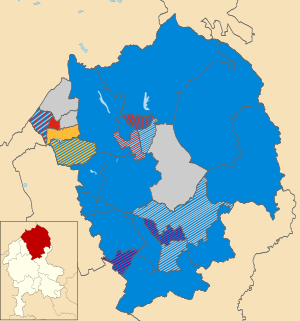
Conservative
Labour
Liberal Democrat
UKIP
Independent / Moorlands Democratic Alliance
The 2015 Staffordshire Moorlands District Council election took place on 7 May 2015 to elect members of Staffordshire Moorlands District Council in England.[1] This was on the same day as other local elections.
After the election, the composition of the council was:
- Conservative 31
- Independent 8
- Labour 7
- Liberal Democrat 2
- Moorlands Democratic Alliance 2
- UKIP 2
Ward results
The candidates highlighted in bold were elected to each ward.
Alton (1 seat) | Party | Candidate | Votes | % | ±% |
| | Conservative | Arthur Sylvester Forrester | 666 | 80 | |
| | Labour | Paul Thomas Powner | 200 | 20 | |
| Majority | 466 | 53.8 | +266 |
| Turnout | 866 | 75.6 | +19.33 |
| | Conservative hold |
Bagnall and Stanley (1 seat) | Party | Candidate | Votes | % | ±% |
| | Conservative | Sybil Evelyn Ralphs | 742 | 75 | |
| | Labour | Paul Thomas Powner | 117 | 12 | |
| | Green | Sarah Elizabeth Colwell | 64 | 6.5 | |
| | Liberal Democrats | David Teasdale | 61 | 6.2 | |
| Majority | 625 | 63.5 | +0.8 |
| Turnout | 984 | 70.29 | +21.51 |
| | Conservative hold |
Biddulph East (3 seats) | Party | Candidate | Votes | % | ±% |
| | Labour | Kevin James Jackson | 1366 | 25.9 | |
| | Labour | Madelaine Mary Lovatt | 1282 | 24.2 | |
| | Labour | Jeanette Ann Walley | 1180 | 22.3 | |
| | Independent | Jill Salt | 734 | 13.9 | |
| | UKIP | Lisa Salt | 723 | 13.7 | |
| Turnout | 5285 | 54.17 | +24.56 |
| | Labour hold |
Biddulph Moor (1 seat) | Party | Candidate | Votes | % | ±% |
| | Independent | John Jones | 544 | 54.1 | |
| | Independent | Hal Wilson | 214 | 21.3 | |
| | Conservative | Agnes Gronkiewicz | 162 | 16.1 | |
| | Labour | Robert Thomas Arthur Whilding | 85 | 8.4 | |
| Majority | 330 | 32.8 | -18.9 |
| Turnout | 1005 | 72.35 | +24.7 |
| | Independent hold |
Biddulph North (3 seats) | Party | Candidate | Votes | % | ±% |
| | Independent | Jim Davis | 1563 | 26.3 | |
| | Independent | Tony Hall | 1556 | 26.1 | |
| | Independent | Andrew Hart | 1355 | 22.8 | |
| | Labour | Eileen Sylvia Rushton | 861 | 14.4 | |
| | Liberal Democrats | Dave Boothroyd | 604 | 10.1 | |
| Turnout | 5939 | 70.84 | 27.84 |
| | Independent hold |
Biddulph South (1 seat) | Party | Candidate | Votes | % | ±% |
| | Liberal Democrats | John Phillip Redfern | 408 | 43.5 | |
| | Labour | Gavin Carl Wood | 279 | 29.7 | |
| | Independent | Ken Harper | 252 | 26.8 | |
| Majority | 156 | 16.6 | +15.6 |
| Turnout | 939 | 67.52 | +21.34 |
| | Liberal Democrats hold |
Biddulph West (3 seats) | Party | Candidate | Votes | % | ±% |
| | Independent | Hilda Mary Sheldon | 1306 | 48.5 | |
| | Conservative | Ian Sinnett Lawson | 1052 | 39.1 | |
| | Labour | Christopher Wood | 984 | 36.6 | |
| | Independent | Elaine Elizabeth Baddeley | 866 | 32.1 | |
| | Labour | Nigel Richard Yates | 789 | 23.3 | |
| | Green | Gareth John Whalley | 382 | 14.2 | |
| Turnout | 2960 | 62.4 | +25.52 |
| | Conservative gain from Independent | Swing | | |
Brown Edge and Endon (3 seats) | Party | Candidate | Votes | % | ±% |
| | Conservative | Linda Doreen Lea | 1180 | 40.3 | |
| | Conservative | Geoff Bond | 1112 | 38.0 | |
| | Liberal Democrats | Christina Rita Jebb | 1101 | 37.6 | |
| | Conservative | Joe Porter | 1067 | 36.4 | |
| | Liberal Democrats | Henry Walter Gladwyn Jebb | 743 | 25.4 | |
| | Liberal Democrats | Danielle Maria Spooner | 572 | 19.5 | |
| | Labour | Andrew Stuart Cunningham Church | 550 | 18.8 | |
| | Labour | Nick Revell | 585 | 20.0 | |
| | Labour | Gareth Richard Taylor | 410 | 14.0 | |
| | Green | Brian Geoffrey Smith | 243 | 8.3 | |
| | Moorlands Democratic Alliance | Andy Wragg | 112 | 3.8 | -3.0 |
| Turnout | 2926 | 72.02 | +21.77 |
| | Conservative gain from Liberal Democrats | Swing | | |
Caverswall (1 seat) | Party | Candidate | Votes | % | ±% |
| | Conservative | Paul John Roberts | 585 | 63.0 | +0.3 |
| | Moorlands Democratic Alliance | Dave Bateman | 343 | 37.0 | -0.9 |
| Majority | 585 | 63.0 | +38.8 |
| Turnout | 928 | 67.31 | +27.63 |
| | Conservative hold | Swing | 0.75 | |
Cheadle North East (2 seats) | Party | Candidate | Votes | % | ±% |
| | Conservative | Julie Dawn Bull | 593 | 37.0 | |
| | UKIP | Peter Wilkinson | 515 | 32.2 | |
| | Conservative | Michael John Shirley | 386 | 24.1 | |
| | Independent | Ian Tracy Whitehouse | 378 | 23.6 | |
| | Labour | John Palfreyman | 340 | 21.3 | |
| | UKIP | Thomas Peter Wilkinson | 228 | 14.25 | |
| | Independent | Phil Routledge | 182 | 11.4 | |
| | Moorlands Democratic Alliance | Ian William Plant | 142 | 8.9 | |
| | Moorlands Democratic Alliance | Sue Walley | 93 | 5.8 | |
| Turnout | 1600 | 56.6 | +22.3 |
| | Conservative hold |
Cheadle South East (2 seats) | Party | Candidate | Votes | % | ±% |
| | Independent | Richard Alcock | 702 | 39.4 | |
| | Conservative | Deb Grocott | 540 | 30.3 | |
| | Independent | Peter James Elkin | 495 | 27.8 | |
| | Conservative | Brian Slaney | 486 | 27.3 | |
| | Labour | Jan Hale | 476 | 26.7 | |
| | Moorlands Democratic Alliance | Neil Plant | 269 | 15.0 | |
| Turnout | 1782 | 60.3 | +22.5 |
| | Conservative gain from Independent | Swing | | |
Cheadle West (3 seats) | Party | Candidate | Votes | % | ±% |
| | Conservative | Stephen Andrew Ellis | 1146 | 53.4 | |
| | Conservative | Alan Banks | 1059 | 49.3 | |
| | Conservative | Peter Mark Jackson | 927 | 43.1 | |
| | Labour | Sam Hale | 648 | 30.2 | |
| | Moorlands Democratic Alliance | Ray Wood | 605 | 28.2 | |
| | Moorlands Democratic Alliance | Ronald Gordon Locker | 539 | 25.1 | |
| | Labour | Joe Baker | 511 | 23.8 | |
| | Labour | Alan Geoffrey Baker | 501 | 23.3 | |
| | Liberal Democrats | Philip Alvin Silk | 211 | 9.8 | |
| Turnout | 2461 | 59.6 | +22.6 |
| | Conservative gain from Moorlands Democratic Alliance | Swing | | |
Checkley (3 seats) | Party | Candidate | Votes | % | ±% |
| | Conservative | Mark Anthony Deaville | 1739 | 55.7 | |
| | Conservative | Colin Pearce | 1604 | 51.4 | |
| | Conservative | David Kingsley Trigger | 1293 | 41.4 | |
| | Labour | Jane Palfreyman | 712 | 22.8 | |
| | Labour | Rosie Hale | 667 | 21.4 | |
| | Moorlands Democratic Alliance | David Wright | 419 | 13.4 | |
| Turnout | 3121 | 67.1 | +26.2 |
| | Conservative hold |
Cheddleton (3 seats) | Party | Candidate | Votes | % | ±% |
| | Conservative | Michael Philip Worthington | 1622 | 52.7 | |
| | Conservative | Michael Thomas Bowen | 1527 | 49.6 | |
| | Conservative | Salvino Scalise | 1388 | 45.1 | |
| | Labour | Mahfooz Ahmad | 987 | 32.1 | |
| | Green | Paul Mark Fenton | 744 | 24.2 | |
| | Moorlands Democratic Alliance | Harold Rensburgh Jennings | 737 | 23.9 | |
| Turnout | 3079 | 69.3 | +24.98 |
| | Conservative gain from Labour | Swing | | |
Churnet (2 seats) | Party | Candidate | Votes | % | ±% |
| | Independent | Ivor John Lucas | 960 | 54.0 | |
| | Conservative | Elsie Fallows | 735 | 41.3 | |
| | Conservative | Bryan Andrew Bull | 662 | 37.2 | |
| Turnout | 1778 | 67.3 | +24.5 |
| | Independent gain from Conservative | Swing | | |
Forsbrook (3 seats) | Party | Candidate | Votes | % | ±% |
| | Conservative | Ian James Herdman | 1141 | 40.3 | |
| | Conservative | Keith Flunder | 989 | 34.9 | |
| | UKIP | Abigail Laura Wilkinson | 889 | 31.4 | |
| | Independent | Gillian Burton | 823 | 29.0 | |
| | Labour | Alan Edward Wilson | 784 | 27.7 | |
| | Moorlands Democratic Alliance | Christine Rose Hopley | 636 | 22.5 | |
| | Moorlands Democratic Alliance | Frank John Hopley | 603 | 21.3 | |
| Turnout | 2830 | 67.3 | +29.3 |
| | UKIP gain from Independent | Swing | | |
Hamps Valley (1 seat) | Party | Candidate | Votes | % | ±% |
| | Conservative | Edwin Thomas John Wain | 726 | 64.2 | |
| | Moorlands Democratic Alliance | Steven Ratcliffe | 234 | 20.7 | |
| | Labour | Terry Riley | 171 | 15.1 | |
| Majority | 492 | 43.5 | -3.5 |
| Turnout | 1131 | 76.5 | +18.0 |
| | Conservative hold | Swing | | |
Horton (1 seat) | Party | Candidate | Votes | % | ±% |
| | Conservative | Norma Hawkins | 951 | 78.9 | |
| | Labour | Lytton Page | 234 | 19.4 | |
| Majority | 717 | 59.5 | +37.6 |
| Turnout | 1205 | 74.1 | +22.3 |
| | Conservative hold | Swing | | |
Ipstones (1 seat) | Party | Candidate | Votes | % | ±% |
| | Moorlands Democratic Alliance | Linda Ann Malyon | 615 | 52.0 | |
| | Conservative | Brian Warrington | 403 | 34.1 | |
| | Labour | Philip James Barks | 156 | 13.2 | |
| Majority | 212 | 17.9 | -1.8 |
| Turnout | 1183 | 76.42 | +17.51 |
| | Moorlands Democratic Alliance hold | Swing | | |
Leek East (3 seats) | Party | Candidate | Votes | % | ±% |
| | Conservative | Rebecca Done | 997 | 38.6 | |
| | Conservative | Brian Charles Johnson | 866 | 33.5 | |
| | Moorlands Democratic Alliance | Pamela Wood | 734 | 28.4 | |
| | Labour | Gwen Gledhill | 694 | 26.9 | |
| | Conservative | Roy Denis Tomkinson | 659 | 25.5 | |
| | Labour | Bill Cawley | 640 | 24.8 | |
| | UKIP | Michael Anthony Mothershaw | 537 | 20.8 | |
| | Moorlands Democratic Alliance | Andrew William Easom | 519 | 20.1 | |
| | Green | Megan Ruth Walmsley-Pitts | 407 | 15.8 | |
| | Liberal Democrats | Judy Gregg | 211 | 8.2 | |
| Turnout | 2583 | 63.87 | +23.85 |
| | Conservative gain from Moorlands Democratic Alliance | Swing | | |
Leek North (3 seats) | Party | Candidate | Votes | % | ±% |
| | Labour | Charlotte Atkins | 1275 | 52.5 | |
| | Labour | Margaret Ann Lovatt | 1130 | 46.5 | |
| | Conservative | Dani Ogden | 938 | 38.6 | |
| | Labour | Darren Anthony Price | 772 | 31.8 | |
| | Green | Keith Robert Naldrett | 447 | 18.4 | |
| Turnout | 2428 | 57.1 | +21.4 |
| | Conservative gain from UKIP | Swing | | |
Leek South (3 seats) | Party | Candidate | Votes | % | ±% |
| | Conservative | Gail Karen Lynn Lockett | 850 | 30.9 | |
| | Labour | Mike Gledhill | 809 | 29.4 | |
| | Independent | Keith Harrison | 789 | 28.7 | |
| | Labour | Susan Coleman | 784 | 28.5 | |
| | Conservative | John Povey | 779 | 28.3 | |
| | Labour | Keith Hoptroff | 698 | 25.4 | |
| | Conservative | Roy Molson | 682 | 24.8 | |
| | Moorlands Democratic Alliance | Roger Adams | 537 | 19.5 | |
| | Moorlands Democratic Alliance | Neil Kirby | 401 | 14.6 | |
| | Green | Francisco Philip Davies | 384 | 14.0 | |
| | Liberal Democrats | Mike Ottewell | 171 | 6.2 | |
| Turnout | 2749 | 61.44 | +23.41 |
| | Labour gain from Conservative | Swing | | |
Leek West (3 seats) | Party | Candidate | Votes | % | ±% |
| | Conservative | Ben Emery | 1157 | 43.4 | |
| | Conservative | Robert Warrington Plant | 994 | 37.3 | |
| | Conservative | Neal Robert Podmore | 921 | 34.5 | |
| | Labour | Susan Webster | 697 | 26.7 | |
| | Moorlands Democratic Alliance | Andy Machin | 506 | 19.0 | |
| | Moorlands Democratic Alliance | Brian Hall | 490 | 18.4 | |
| | Green | Mark Sidebotham | 400 | 15.0 | |
| | Liberal Democrats | Roy Gregg | 380 | 14.3 | |
| | Independent | Jason Gregory Banks | 293 | 11.0 | |
| | Independent | Brian Harry Pointon | 184 | 6.9 | |
| Turnout | 2665 | 69.7 | +25.6 |
| | Conservative gain from Liberal Democrats | Swing | | |
Manifold (1 seat) | Party | Candidate | Votes | % | ±% |
| | Conservative | Teresa Riley | 888 | 77.8 | |
| | UKIP | Gary William Salt | 204 | 17.9 | |
| Majority | 684 | 59.9 | +10.7 |
| Turnout | 1142 | 75.53 | +22.63 |
| | Conservative hold | Swing | | |
Werrington (2 seats) | Party | Candidate | Votes | % | ±% |
| | Conservative | David Shaw | 1017 | 55.9 | |
| | Conservative | Ross David Ward | 697 | 38.3 | |
| | Staffordshire Independent Group | Lisa Martin | 554 | 30.5 | |
| | Labour | Jocelyn Anne Morrison | 487 | 26.8 | |
| | Labour | Doreen Jones | 471 | 25.9 | |
| Turnout | 1817 | 68.21 | +27.5 |
| | Conservative gain from Staffordshire Independent Group | Swing | | |
References
- ^ "Upcoming elections & referendums". The Electoral Commission. Archived from the original on 15 March 2015. Retrieved 24 April 2015.
- 2015 election results Archived 15 August 2016 at the Wayback Machine
- 2011 election results


