2021 UK local government election
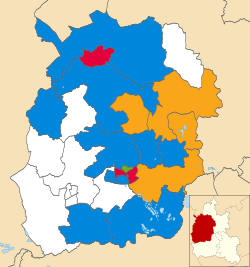
Map showing the results of the 2021 West Oxfordshire District Council election The 2021 West Oxfordshire District Council election took place on 6 May 2021 to elect members of West Oxfordshire District Council in Oxfordshire, England.[1]
Results summary 2021 West Oxfordshire District Council election Party This election Full council This election Seats Net Seats % Other Total Total % Votes Votes % +/− Conservative 10 55.6 18 28 57.1 12,004 42.1 +3.0 Liberal Democrats 4 22.2 6 10 20.4 6,851 24.0 -0.3 Labour 3 16.7 5 8 20.4 6,328 22.2 -0.8 Independent 0 0.0 2 2 4.1 143 0.5 -3.5 Green 1 5.6 0 1 2.0 3,132 11.0 +2.0 Reform UK 0 0.0 0 0 0.0 27 0.1 New Burning Pink 0 0.0 0 0 0.0 15 0.1 New
Ward results Bampton and Clanfield Bampton and Clanfield (by-election) Party Candidate Votes % ±% Conservative Rupert Dent 803 64.4 +1.7 Green Alma Tumilowicz 242 19.4 N/A Labour Sarah Hayton 202 16.2 +5.4 Majority 561 45.0 +8.7 Turnout 1,256 38.7 +4.1 Conservative hold Swing
Chadlington and Churchill Chadlington and Churchill Party Candidate Votes % ±% Conservative Dean Temple 328 45.2 -20.5 Liberal Democrats Nigel Ridpath 235 32.4 +21.5 Green James Styring 101 13.9 +0.8 Labour Co-op David Heyes 61 8.4 -1.9 Majority 93 12.8 Turnout 744 45.0 +3.8 Conservative hold Swing
Charlbury and Finstock Charlbury and Finstock Party Candidate Votes % ±% Liberal Democrats Liz Leffman 884 54.6 +9.0 Conservative Caspar Morris 407 25.2 -5.3 Green Liz Reason 205 12.7 -3.1 Labour Co-op Sue Richards 122 7.5 -0.6 Majority 477 29.4 +14.3 Turnout 1,645 53.5 +5.3 Liberal Democrats hold Swing
Chipping Norton Chipping Norton Party Candidate Votes % ±% Labour Co-op Geoff Saul 1,201 54.8 +14.3 Conservative Ruth Obasa 616 28.1 -5.3 Green Malcolm Brown 263 12.0 N/A Liberal Democrats Ivan Aguado Melet 113 5.2 -21.0 Majority 585 26.7 +19.6 Turnout 2,264 40.5 +2.6 Labour Co-op hold Swing
Eynsham and Cassington Eynsham and Cassington Party Candidate Votes % ±% Liberal Democrats Andrew Goodwin 1,391 55.4 +2.4 Conservative Sean Grace 783 31.2 +7.9 Labour Elsa Dawson 191 7.6 -0.2 Green Ed Rolison 145 5.8 -10.0 Majority 608 24.2 -5.5 Turnout 2,522 50.4 +10.7 Liberal Democrats gain from Conservative Swing
Freeland and Hanborough Freeland and Hanborough Party Candidate Votes % ±% Conservative Alaa Al-Yousuf 893 51.7 +14.6 Liberal Democrats Lidia Arciszewska 482 27.9 +20.4 Labour Tommy Begley 182 10.5 -35.1 Green Angela Wilson 154 6.9 +1.3 Burning Pink Dave Baldwin 15 0.9 N/A Majority 411 23.8 — Turnout 1,740 45.2 -2.5 Conservative hold Swing
Hailey, Minster Lovell and Leafield Hailey, Minster Lovell and Leafield Party Candidate Votes % ±% Conservative Colin Dingwall 801 55.1 +9.1 Liberal Democrats Paul Marsh 653 44.9 +12.3 Majority 148 10.2 -3.2 Turnout 1,467 44.1 +4.9 Conservative hold Swing
Kingham, Rollright and Enstone Kingham, Rollright and Enstone Party Candidate Votes % ±% Conservative Alex Wilson 725 54.3 +1.4 Labour Andrew Hornung 324 24.3 +10.9 Green Amy Long 163 12.2 -5.4 Liberal Democrats Mike Baggaley 124 9.3 -6.8 Majority 401 30.0 -5.3 Turnout 1,362 41.6 +7.6 Conservative hold Swing
Milton-under-Wychwood Milton-under-Wychwood Party Candidate Votes % ±% Conservative Jeff Haine 464 58.1 -10.2 Liberal Democrats Sophie Kitching 173 21.7 +6.5 Labour Co-op Sian O'Neill 87 10.9 +1.3 Green Tim Eden 75 9.4 +2.5 Majority 291 36.4 Turnout 807 45.2 +3.5 Conservative hold Swing
North Leigh North Leigh Party Candidate Votes % ±% Conservative Harry St John 460 59.3 -4.9 Labour Maureen Eades 119 15.3 -6.0 Liberal Democrats Gillian Workman 112 14.4 +10.2 Green Julia Shay 85 11.0 +0.7 Majority 341 44.0 Turnout 786 44.6 +0.8 Conservative hold Swing
Standlake, Aston and Stanton Standlake, Aston and Stanton Party Candidate Votes % ±% Conservative Lysette Nicholls 983 56.3 +0.1 Liberal Democrats Marcus Luckett 596 34.1 +23.9 Labour Mike Parker 167 9.6 -1.6 Majority 387 22.2 Turnout 1,769 49.2 +13.2 Conservative hold Swing
Stonesfield and Tackley Stonesfield and Tackley Party Candidate Votes % ±% Liberal Democrats Mathew Parkinson 693 40.0 -5.7 Conservative Richard Jackson 668 38.6 +4.4 Green Frances Mortimer 232 13.4 +0.6 Labour Nell Davies-Small 138 8.0 +0.7 Majority 25 1.4 -10.1 Turnout 1,751 50.0 +5.7 Liberal Democrats gain from Conservative Swing
Witney Central Witney Central Party Candidate Votes % ±% Labour Andrew Coles 810 52.9 +5.6 Conservative Craig Brown 526 34.3 -1.2 Green Harriet Kopinska 100 6.5 -3.3 Liberal Democrats Andy Bailey 69 4.5 -2.9 Reform UK Mark Bezerra Speeks 27 1.8 N/A Majority 284 18.6 +6.8 Turnout 1,540 36.2 +2.8 Labour hold Swing
Witney East Witney East Party Candidate Votes % ±% Labour Co-op Duncan Enright 1,167 47.8 -2.7 Conservative Rich Hikins 862 35.3 -0.2 Green Sandra Simpson 294 12.0 N/A Liberal Democrats Christopher Blount 117 4.8 -9.2 Majority 305 12.5 -2.5 Turnout 2,473 42.9 +7.0 Labour Co-op hold Swing
Witney North Witney North Party Candidate Votes % ±% Green Andrew Prosser 648 41.7 +28.7 Conservative Toby Morris 487 31.3 +7.8 Labour Co-op Ruth Smith 351 22.6 +1.3 Independent Pete Handley 68 4.4 N/A Majority 161 10.4 — Turnout 1,562 50.2 +8.9 Green gain from Conservative Swing
Witney South Witney South Party Candidate Votes % ±% Conservative Mark Johnson 828 45.0 +7.5 Labour Michael Brooker 638 34.7 -6.1 Green Carol Cather 164 8.9 -5.7 Liberal Democrats Kate Southey 136 7.4 +0.3 Independent Adrian Henry-Wyatt 75 4.1 N/A Majority 190 10.3 — Turnout 1,885 38.0 +5.0 Conservative hold Swing
Witney West Witney West Party Candidate Votes % ±% Conservative Jane Doughty 753 52.5 +6.3 Labour Co-op Stuart McCarroll 427 29.8 +11.7 Liberal Democrats Peter Whitten 154 10.7 -16.3 Green Penny Ponton 101 7.0 -1.8 Majority 326 22.7 +3.5 Turnout 1,462 35.4 +1.0 Conservative hold Swing
Woodstock and Bladon Woodstock and Bladon Party Candidate Votes % ±% Liberal Democrats Elizabeth Poskitt 919 50.0 +8.0 Conservative Jo Lamb 617 33.6 +5.6 Green Barry Wheatley 160 8.7 -1.9 Labour Mark Lambert 141 7.7 -1.0 Majority 302 16.4 Turnout 1,865 53.4 +9.6 Liberal Democrats hold Swing
References ^ "Declarations of Results" (PDF) . West Oxfordshire District Council Electoral Services . Retrieved 30 May 2021 .
 3
3  2
2 


