2008 UK local government election
South Cambridgeshire District Council election, 2008
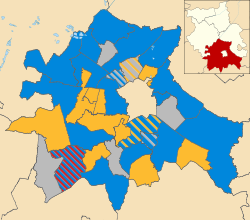
Results by ward of the 2008 local election in South Cambridgeshire
Overall composition of the council following the 2008 election
Elections to South Cambridgeshire District Council took place on Thursday 1 May 2008, as part of the 2008 United Kingdom local elections. Twenty seats, making up just over one third of South Cambridgeshire District Council, were up for election. Both seats in Gamlingay were contested at this election after one of the councillors retired earlier in the year.[1] Seats up for election in 2008 were last contested at the 2004 election, and were next contested at the 2012 election. The Conservative Party retained their majority on the council.
Summary
At this election, Conservatives were defending 8 seats, Independents were defending 6 seats and Liberal Democrats 5 seats. Labour were defending their only seat on the council in Bassingbourn. Several councillors had switched parties in the year leading up to the election, with independents Mark Howell (Papworth and Elsworth) and Simon Edwards (Cottenham) joining the Conservatives, while Liberal Democrat James Quinlan (Whittlesford) ran for re-election as an Independent.[2] Incumbent Liberal Democrat Val Trueman also ran as an independent in Melbourn. Conservatives gained the latter two seats at the election, but lost in Girton to an independent candidate. No other seats changed hands.
Results
| South Cambridgeshire District Council election, 2008[3] |
| Party | Seats | Popular vote |
| Won | Not up | Total | ± | Votes | % |
| | Conservative | 9 | 23 | 32 | +1 | 12,797 | 44.0 |
| | Liberal Democrats | 5 | 10 | 15 | 0 | 9,362 | 32.2 |
| | Independent | 5 | 4 | 9 | −1 | 4,603 | 15.8 |
| | Labour | 1 | 0 | 1 | 0 | 1,583 | 5.4 |
| | Green | 0 | 0 | 0 | 0 | 693 | 2.4 |
| | UKIP | 0 | 0 | 0 | 0 | 29 | 0.1 |
| Total | 20 | 37 | 57 | – | 29,067 | – |
| Turnout | 41.3 |
Results by ward
Bassingbourn Ward[4] | Party | Candidate | Votes | % | ±% |
| | Labour | Nigel Nielsen Cathcart | 576 | 39.5 | +6.8 |
| | Conservative | Adrian Neil Dent | 447 | 30.7 | −16.1 |
| | Independent | Peter James Robinson | 247 | 16.9 | N/A |
| | Green | Simon Peter Saggers | 188 | 12.9 | −7.7 |
| Majority | 129 | | |
| Turnout | | 41.6 | |
| | Labour hold | Swing | | |
Bourn Ward[4] | Party | Candidate | Votes | % | ±% |
| | Conservative | Mervyn Benjamin Loynes | 922 | 49.4 | −5.3 |
| | Liberal Democrats | Roger Keith Hume | 778 | 41.7 | +7.4 |
| | Labour | Mark David Hurn | 168 | 8.9 | +2.1 |
| Majority | 144 | | |
| Turnout | | 34.5 | |
| | Conservative hold | Swing | | |
Cottenham Ward[4] | Party | Candidate | Votes | % | ±% |
| | Conservative | Simon Mark Edwards | 1,256 | 57.6 | +21.5 |
| | Liberal Democrats | Matthew James Barnett | 583 | 26.8 | +0.6 |
| | Green | Heather Anne Macbeth-Hornett | 173 | 7.9 | N/A |
| | Labour | John Samuel Shepherd | 167 | 7.7 | N/A |
| Majority | 673 | | |
| Turnout | | 36.2 | |
| | Conservative hold | Swing | | |
Gamlingay Ward[4] | Party | Candidate | Votes | % | ±% |
| | Liberal Democrats | Sebastian Gerald Molesworth Kindersley | 1,030 | 34.3 | −3.8 |
| | Liberal Democrats | Bridget Zoe Dorrington Smith | 897 | 29.9 | −1.2 |
| | Conservative | Celia Brenda Waldron | 558 | 18.7 | +2.3 |
| | Conservative | Lister John Wilson | 507 | 16.9 | +2.6 |
| Turnout | | 41.0 | |
| | Liberal Democrats hold | Swing | | |
| | Liberal Democrats hold | Swing | | |
Girton Ward[4] | Party | Candidate | Votes | % | ±% |
| | Independent | Douglas de Lacey | 715 | 47.3 | N/A |
| | Conservative | Mark Jonathan Taylor | 564 | 37.3 | −18.3 |
| | Labour | Christopher Jones | 104 | 6.9 | N/A |
| | Green | Teal Richard Riley | 99 | 6.6 | −13.6 |
| | UKIP | Helene Yvette Davis | 29 | 1.9 | N/A |
| Majority | 151 | | |
| Turnout | | 46.8 | |
| | Independent gain from Conservative | Swing | | |
Harston and Hauxton Ward[4] | Party | Candidate | Votes | % | ±% |
| | Liberal Democrats | Janet Elizabeth Lockwood | 501 | 59.5 | +13.7 |
| | Conservative | Richard Michael Turner | 282 | 33.5 | −3.9 |
| | Green | Jackie Garfit | 59 | 7.0 | −4.1 |
| Majority | 77 | | |
| Turnout | | 49.1 | |
| | Liberal Democrats hold | Swing | | |
Haslingfield and the Eversdens Ward[4] | Party | Candidate | Votes | % | ±% |
| | Liberal Democrats | Liz Heazell | 602 | 48.6 | −8.7 |
| | Independent | Robin Page | 471 | 38.1 | N/A |
| | Conservative | Mandy Lorraine Smith | 165 | 13.3 | −17.8 |
| Majority | 131 | | |
| Turnout | | 60.1 | |
| | Liberal Democrats hold | Swing | | |
Histon and Impington Ward[4] | Party | Candidate | Votes | % | ±% |
| | Independent | Mike Mason | 957 | 35.6 | +19.1 |
| | Liberal Democrats | Vanessa Ann Kelly | 900 | 33.4 | −1.1 |
| | Conservative | Philip 'Scotty' Scott | 632 | 23.5 | −8.1 |
| | Labour | Christopher Jeffrey Wilson | 129 | 4.8 | −3.4 |
| | Green | William Jon Quinn | 73 | 2.7 | −1.7 |
| Majority | 57 | | |
| Turnout | | 42.3 | |
| | Independent hold | Swing | | |
Linton Ward[4] | Party | Candidate | Votes | % | ±% |
| | Liberal Democrats | John Dennis Batchelor | 939 | 58.3 | −2.4 |
| | Conservative | Roger Keith Hickford | 672 | 41.7 | +8.9 |
| Majority | 267 | | |
| Turnout | | 45.3 | |
| | Liberal Democrats hold | Swing | | |
Longstanton Ward[4] | Party | Candidate | Votes | % | ±% |
| | Independent | Alex Riley | 435 | 55.0 | −12.3 |
| | Conservative | Roger Owen Valentine | 356 | 45.0 | +24.1 |
| Majority | 79 | | |
| Turnout | | 43.2 | |
| | Independent hold | Swing | | |
Melbourn Ward[4] | Party | Candidate | Votes | % | ±% |
| | Conservative | Val Barrett | 1,053 | 55.5 | +14.6 |
| | Liberal Democrats | Christine Dallas Cartwright | 534 | 28.2 | −23.1 |
| | Independent | Val Trueman | 203 | 10.7 | N/A |
| | Labour | Hywel Lamont Jackson | 107 | 5.6 | N/A |
| Majority | 519 | | |
| Turnout | | 45.5 | |
| | Conservative gain from Independent | Swing | | |
Papworth and Elsworth Ward[4] | Party | Candidate | Votes | % | ±% |
| | Conservative | Mark Phillip Howell | unopposed | N/A | N/A |
| | Conservative hold | Swing | | |
Sawston Ward[4] | Party | Candidate | Votes | % | ±% |
| | Independent | Sally Ann Hatton | 747 | 51.3 | +28.9 |
| | Conservative | Richard Louis Denham | 709 | 48.7 | −0.8 |
| Majority | 38 | | |
| Turnout | | 27.2 | |
| | Independent hold | Swing | | |
The Mordens Ward[4] | Party | Candidate | Votes | % | ±% |
| | Independent | Cicely Anne Elsa Demain Murfitt | 547 | 63.1 | −14.9 |
| | Conservative | Robert James Poulter | 219 | 25.3 | N/A |
| | Green | Sam Morris | 101 | 11.7 | −10.3 |
| Majority | 328 | | |
| Turnout | | 47.3 | |
| | Independent hold | Swing | | |
The Shelfords and Stapleford Ward[4] | Party | Candidate | Votes | % | ±% |
| | Conservative | Charles Reginald Nightingale | 1,379 | 57.4 | −7.6 |
| | Liberal Democrats | Sarah Catherine Whitebread | 857 | 35.7 | +13.5 |
| | Labour | Michael Robert Nettleton | 168 | 6.9 | −5.9 |
| Majority | 522 | | |
| Turnout | | 44.1 | |
| | Conservative hold | Swing | | |
The Wilbrahams Ward[4] | Party | Candidate | Votes | % | ±% |
| | Conservative | Robert John Turner | 639 | 70.9 | +9.9 |
| | Liberal Democrats | Frances Amrani | 262 | 29.1 | −9.9 |
| Majority | 377 | | |
| Turnout | | 44.6 | |
| | Conservative hold | Swing | | |
Waterbeach Ward[4] | Party | Candidate | Votes | % | ±% |
| | Conservative | James Andrew Hockney | 1,148 | 60.3 | +20.5 |
| | Liberal Democrats | Adrian James Wright | 700 | 36.8 | +3.1 |
| | Labour | Jess Blair | 57 | 2.9 | N/A |
| Majority | 448 | | |
| Turnout | | 48.5 | |
| | Conservative hold | Swing | | |
Whittlesford Ward[4] | Party | Candidate | Votes | % | ±% |
| | Conservative | Peter William Wilson Topping | 403 | 39.6 | +3.6 |
| | Liberal Democrats | Michael Kilpatrick | 334 | 32.8 | −31.2 |
| | Independent | James Alex Quinlan | 282 | 27.7 | N/A |
| Majority | 69 | | |
| Turnout | | 51.3 | |
| | Conservative gain from Independent | Swing | | |
Willingham and Over Ward[4] | Party | Candidate | Votes | % | ±% |
| | Conservative | Ray Maurice Antony Manning | 1,109 | 66.8 | +12.8 |
| | Liberal Democrats | Leslie Gelling | 445 | 26.8 | −8.9 |
| | Labour | Norman Alexander Crowther | 107 | 6.4 | N/A |
| Majority | 664 | | |
| Turnout | | 32.9 | |
| | Conservative hold | Swing | | |
References
- ^ "Councillor Ann Elsby steps down from South Cambridgeshire District Council". South Cambridgeshire District Council. 12 March 2008. Archived from the original on 5 August 2012. Retrieved 5 May 2012.
- ^ "Political changes at South Cambridgeshire District Council". South Cambridgeshire District Council. 10 May 2007. Archived from the original on 5 August 2012. Retrieved 5 May 2012.
- ^ District Council Elections - Thursday, 1 May 2008, South Cambridgeshire District Council
- ^ a b c d e f g h i j k l m n o p q r s "Election results by ward". South Cambridgeshire District Council. 1 May 2008. Retrieved 5 May 2012.

 Council elections in Cambridgeshire


